What Is a Flame Graph? Reading CPU Profiles Visually
A flame graph visualizes sampled stack traces so the widest bars show where a program spends its time. How to read one, build one, and avoid common traps.
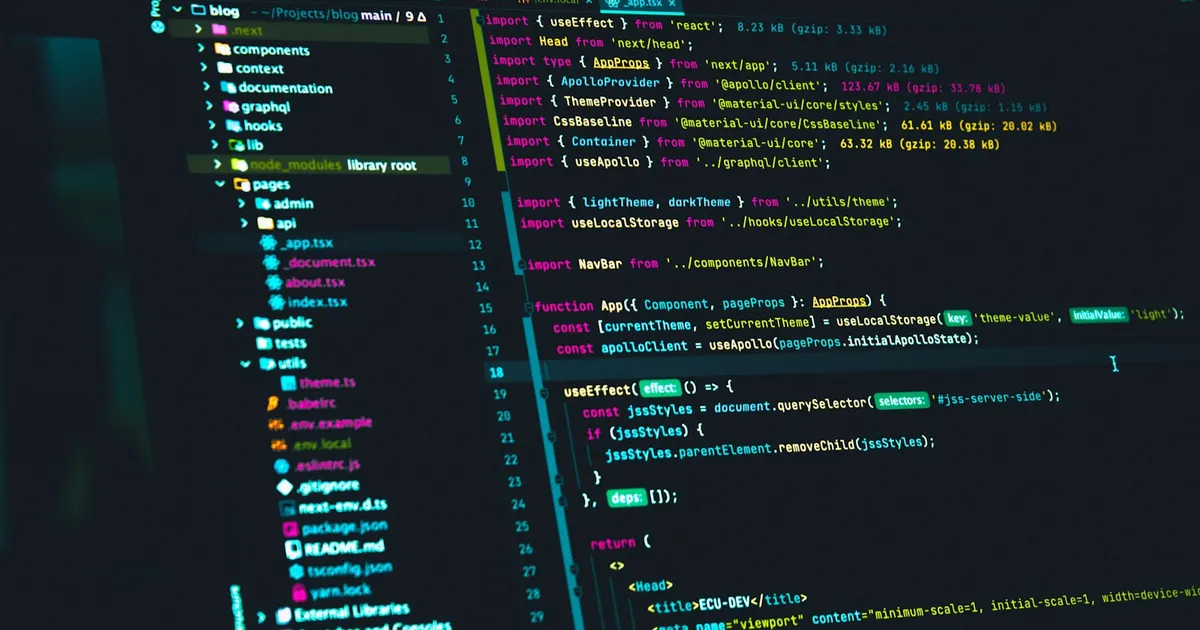
A flame graph is a visualization of sampled stack traces in which each box is a function, boxes are stacked by call depth, and the width of each box shows how often that function appeared in the samples. The practical upshot: the widest boxes are where your program spends its time. Instead of scrolling through thousands of lines of profiler output, you look for the wide plateaus and start there.
Where the data comes from
Most flame graphs are built from a sampling profiler. Many times per second, the profiler interrupts the program and records the current call stack — the chain of functions from main down to whatever is executing at that instant. After a few seconds you have thousands of stacks. Many of them are identical, and identical stacks are where the hot code lives.
Sampling is cheap compared with instrumenting every function call, which is why it is safe to run against production. Profilers often choose a slightly odd frequency, such as 99 samples per second rather than 100, so the sampling does not fall into lockstep with periodic work in the program and skew the results.
The raw samples are then “folded”: every unique stack is written as one line, with frames separated by semicolons and a count at the end.
main;handleRequest;parseJSON 412
main;handleRequest;queryDB;serialize 187
main;handleRequest;render;escapeHTML 903
The flame graph is just a drawing of those folded lines.
How to read a flame graph
The layout has two axes, and only one of them means what most people first assume.
- The y-axis is stack depth. The bottom row is the root (often the process or thread entry point). Each row above it is a function called by the box beneath it. The top edge of any tower is the function that was actually on the CPU when the sample was taken.
- The x-axis is not time. In a classic flame graph, sibling boxes are sorted alphabetically so identical frames merge into a single wide box. Width is the share of total samples that included that frame. Left-to-right position carries no meaning.
Two questions get you most of the value:
- Which boxes are wide? A wide box means a function was on the stack for a large fraction of samples, either because it did the work itself or because something it called did.
- Which boxes are wide at the top? A box with nothing above it — a flat plateau — is a function spending time in its own code rather than in its children. That is self time, and it is usually the most actionable thing on the chart.
If render is wide but almost entirely covered by escapeHTML, the problem is escaping, not rendering. If parseJSON is wide and flat on top, the parser itself is the hot spot.
Colors in a standard CPU flame graph are usually just warm random hues to separate adjacent boxes. Some tools use color to encode meaning, such as language runtime, kernel versus user code, or module, so check the legend before reading anything into it.
Flame graphs vs flame charts
The names are close and the pictures look similar, which causes real confusion.
| Flame graph | Flame chart | |
|---|---|---|
| X-axis | Proportion of samples (sorted, merged) | Wall-clock time |
| Identical stacks | Merged into one wide box | Shown separately each time they occur |
| Best for | Finding aggregate hot paths | Seeing ordering, gaps, and individual long calls |
| Typical home | Server-side and CLI profilers | Browser performance panels |
Browser developer tools show flame charts in their performance recordings, because front-end work is about sequencing: a long task that blocks input matters even if it happens once. That is the view you want when you are learning how the JavaScript event loop schedules work or trying to break up long tasks. For a server burning CPU across millions of requests, the merged flame graph is more useful because it collapses repetition into a single clear signal.
Variations worth knowing
Icicle graphs are flame graphs drawn upside down, with the root at the top. The data is the same; some tools default to this orientation.
Off-CPU flame graphs sample stacks while threads are blocked — waiting on locks, disk, or the network — rather than running. A service can be slow while using little CPU, and an on-CPU profile will hide that entirely. Kernel tracing tools built on eBPF make this kind of profile practical on Linux.
Memory and allocation flame graphs use the same layout but weight boxes by bytes allocated instead of samples. They are handy for tracking down allocation churn that drives pressure on the garbage collector.
Differential flame graphs compare two profiles, typically before and after a change, and color boxes by whether they grew or shrank. They answer “what got slower?” without eyeballing two charts side by side.
Building one in practice
The workflow is the same whatever the language:
- Record samples with a profiler for your runtime: a system profiler for native code, or the built-in profiler of your language runtime. Run it under realistic load; profiling an idle service tells you about the idle loop.
- Make sure symbols resolve. Stripped binaries, missing debug info, and JIT-compiled code without symbol maps show up as hex addresses or
[unknown]boxes. JIT runtimes usually need a flag to emit a symbol map the profiler can read. - Fold and render the stacks. Many modern profilers and observability platforms render interactive flame graphs directly, with search, zoom, and click-to-focus.
- Zoom into the widest tower, find the plateau, and form a hypothesis. Change one thing, profile again, and compare.
Continuous profiling extends this by sampling production all the time at low overhead and storing the results, so you can pull up a flame graph for last Tuesday’s latency spike. It complements distributed tracing: a trace tells you which service and span were slow, and a profile tells you which code inside that span burned the time. Both are pieces of a broader observability practice.
Common mistakes
- Reading the x-axis as a timeline. In a flame graph it is not. Order is alphabetical; only width matters.
- Chasing narrow towers. A tall, skinny stack looks dramatic but represents few samples. Height is call depth, not cost.
- Ignoring self time. A wide box covered by children is a signpost, not the destination. Follow it up to the flat tops.
- Profiling too briefly. A one-second sample of a bursty workload can miss the hot path. Capture enough samples that the shape stabilizes when you re-run.
- Assuming CPU is the bottleneck. If the service is slow but CPU is low, you need an off-CPU or wall-clock profile instead.
The takeaway
A flame graph turns thousands of sampled call stacks into one picture where width equals cost. Read it bottom-up for call relationships, ignore left-to-right order, and look for wide, flat tops — that is where the time goes. Use a time-ordered flame chart when sequence matters, an off-CPU graph when the program is waiting rather than working, and a differential graph to prove that a fix actually helped.
Keep reading
 The Lycoris Team · · 5 min read
Huge Pages Explained: Bigger Memory Pages, Fewer TLB Misses
Huge pages map memory in 2 MB or 1 GB chunks instead of 4 KB, cutting TLB misses for memory-heavy workloads. How they work and when to use them.
 Takina · · 5 min read
What Is Zstandard (zstd)? Fast Compression Explained
Zstandard (zstd) is a lossless compression algorithm that pairs gzip-beating ratios with very fast decompression. How it works and when to use it.
 The Lycoris Team · · 5 min read
UTF-8 Explained: How Unicode Text Becomes Bytes
UTF-8 is the variable-length encoding that turns Unicode characters into one to four bytes. How it works, why it won, and how it compares with UTF-16.