Technical Analysis vs Fundamental Analysis Explained
Fundamental analysis values a company from its financials; technical analysis reads price charts for patterns. How each approach works, and when to use them.
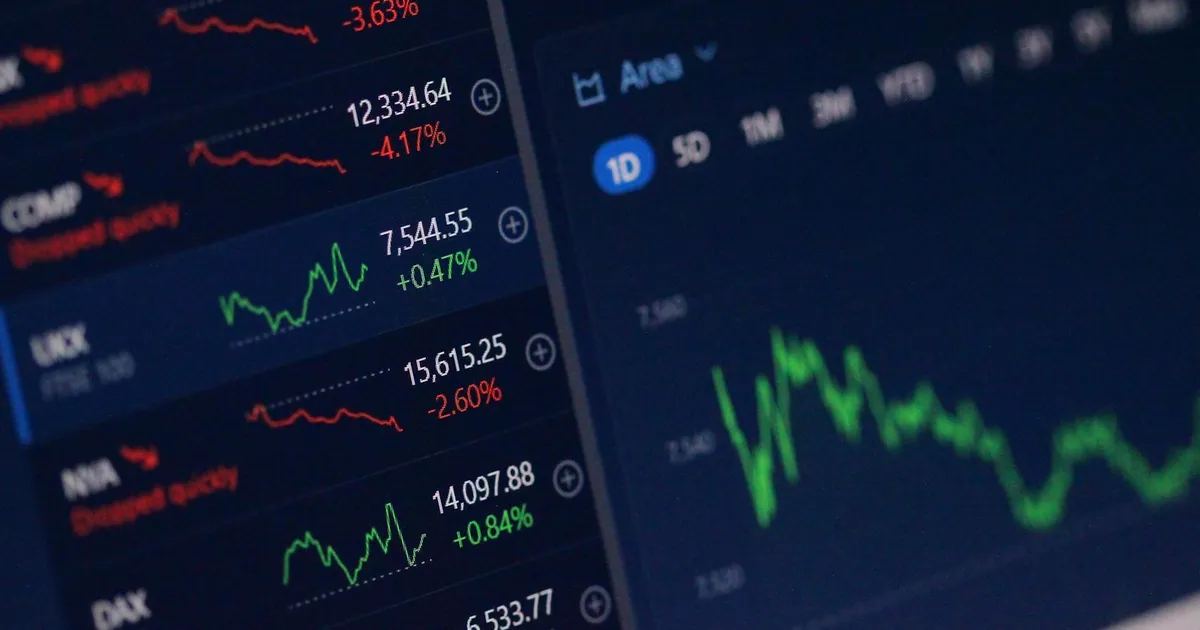
Fundamental analysis and technical analysis are the two dominant frameworks investors use to decide what to buy and when — fundamental analysis asks “what is this company actually worth?” by digging into its financial statements and business, while technical analysis asks “what is the price likely to do next?” by studying patterns in the price and volume data itself. They’re not opposing camps so much as answers to different questions, and plenty of investors use both.
Fundamental analysis: valuing the business
Fundamental analysis starts from the premise that a stock represents ownership of a real business, and that business has an intrinsic value independent of whatever the market happens to be paying for it today. The analyst’s job is to estimate that intrinsic value and compare it to the current price — if the estimate comes in well above the price, the stock looks undervalued; well below, overvalued.
That estimate is built from the company’s financial statements — the income statement, balance sheet, and cash flow statement, covered in our guide to the three financial statements — plus qualitative factors like competitive position, management quality, and industry trends. Common tools include:
- Valuation ratios like the price-to-earnings ratio and price-to-book ratio, which compare price to some measure of fundamental value.
- DCF valuation, which projects a company’s future cash flows and discounts them back to a present value.
- Profitability and efficiency metrics, like operating margin and return on equity.
- An economic moat — durable competitive advantages that let a company defend its profits from competitors over the long run.
The fundamental analyst’s time horizon tends to be long: the thesis is that price eventually converges toward intrinsic value, but the “eventually” can take years, and a fundamentally cheap stock can stay cheap (or get cheaper) for a long time before the market agrees with the analysis.
Technical analysis: reading the price
Technical analysis largely ignores the underlying business and instead treats the price chart itself as the primary source of information, on the theory that price and volume already reflect everything the market collectively knows (and feels) about a security — including information a fundamental model can’t easily quantify, like shifting sentiment or positioning. Rather than asking what a company is worth, technicians ask what the current pattern of price movement suggests about what other market participants will do next.
Common technical tools include:
- Moving averages, which smooth out short-term noise to reveal trend direction — see what a moving average is and how crossovers like the golden cross and death cross are read as trend signals.
- Support and resistance levels — price zones where a stock has historically reversed direction, treated as psychologically significant.
- Volume analysis, which weighs a price move by how much trading activity accompanied it — a move on heavy volume is read as more significant than the same move on thin volume.
- Chart patterns and oscillators, from head-and-shoulders formations to momentum indicators like the RSI, used to time entries and exits rather than to answer “is this a good company.”
Technical analysis operates on much shorter time horizons than fundamental analysis in practice, though nothing about the method itself requires that — some technicians apply it to weekly or monthly charts for longer-term trend-following, not just intraday trading.
The philosophical disagreement underneath
The two approaches don’t just use different tools; they rest on different assumptions about markets. Technical analysis is compatible with (though not dependent on) weak-form market efficiency — the idea that only past price data is already reflected in current prices, leaving room for patterns to matter. Strict believers in the efficient market hypothesis, in its stronger forms, are skeptical of both: if all available information (fundamental or technical) is already priced in, neither approach should reliably beat a simple index fund, which is a large part of why low-cost index investing attracts capital from people who doubt either method’s ability to consistently outperform the market.
Technical vs fundamental analysis
| Fundamental analysis | Technical analysis | |
|---|---|---|
| Core question | What is this company worth? | Where is the price likely headed? |
| Primary inputs | Financial statements, industry, management | Price, volume, chart patterns |
| Typical horizon | Long-term (years) | Shorter-term (days to months), though not strictly |
| Underlying assumption | Price converges to intrinsic value over time | Price patterns and volume reveal future price behavior |
| Common tools | P/E ratio, DCF, margins, economic moat | Moving averages, support/resistance, volume, oscillators |
| Best suited for | Selecting what to own | Timing when to enter or exit |
Using both together
In practice, a lot of investors and traders blend the two rather than picking a side: use fundamental analysis to decide a company is worth owning, then use technical analysis to time the entry — waiting for a chart pattern or moving-average signal that suggests near-term downward pressure has eased, for instance, rather than buying purely on the fundamental thesis the moment it forms. Others reject the blend entirely and specialize in one discipline. Neither approach guarantees returns; both are frameworks for organizing an analysis, not formulas that remove judgment or risk from the decision.
The takeaway
Fundamental analysis values a business from its financial statements and competitive position, betting that price eventually reflects that value; technical analysis reads price and volume patterns directly, betting that market behavior itself contains predictive signal. Neither approach subsumes the other — they answer different questions on different time horizons — which is why many investors use fundamentals to pick what to own and technicals to help decide when to act on that decision.
Tagged
Keep reading

 Kurumi · · 5 min read
 What Is a Dual-Class Share Structure?
A dual-class share structure gives some shares more votes than others, so founders keep control with a minority stake. How it works and the trade-offs.
 Kurumi · · 5 min read
 What Is Deferred Revenue? Unearned Revenue, Explained
Deferred revenue is cash a company has received for goods or services it has not yet delivered. How it is recorded, recognized, and read by investors.
 Kurumi · · 5 min read
 What Is Operating Leverage? Fixed Costs and Profit Swings
Operating leverage measures how much a company's operating profit changes when revenue changes, driven by its fixed costs. How it works and why it matters.